Dominion Atlantic Railway Digital Preservation Initiative - Wiki
Use of this site is subject to our Terms & Conditions.
Category:Track Charts
From DARwiki
Track Plans & Elevations
Notes
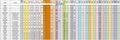
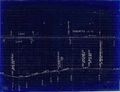
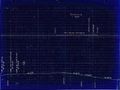
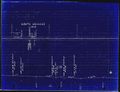
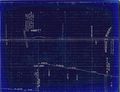
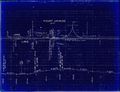
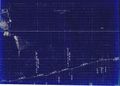
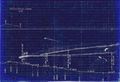
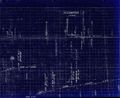
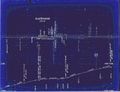
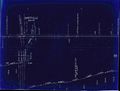
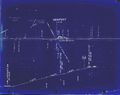
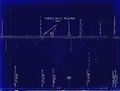
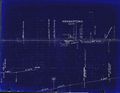
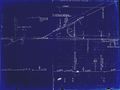
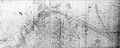
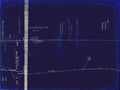
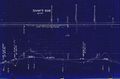
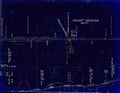
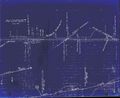
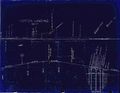
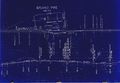
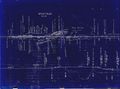
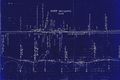
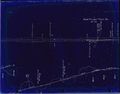
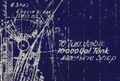
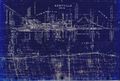
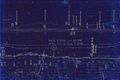
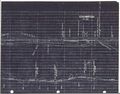
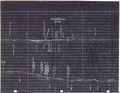
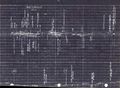
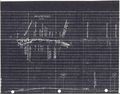
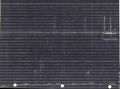
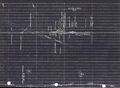
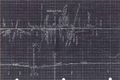
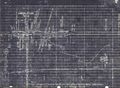
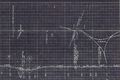
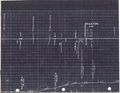
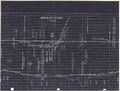
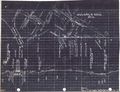
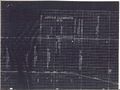
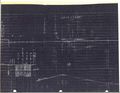
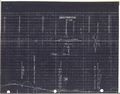
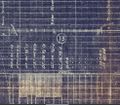
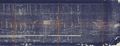
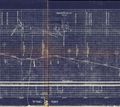
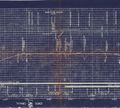
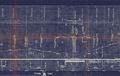
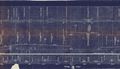
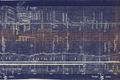
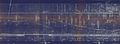
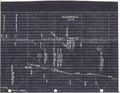
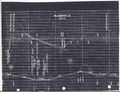
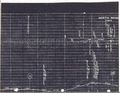
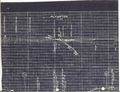
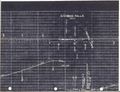
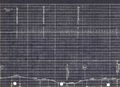
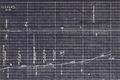
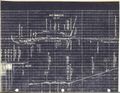
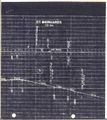
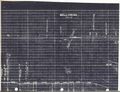
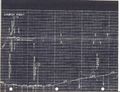
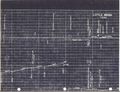
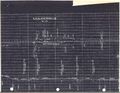
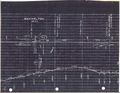
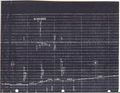
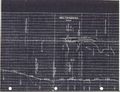
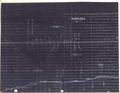
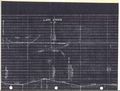
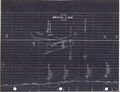
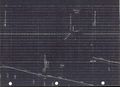
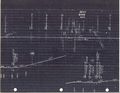
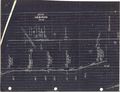
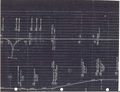
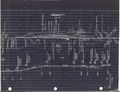
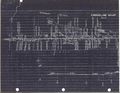
- The track charts shown are clips of sections of large drawings representing 20 miles each from original 1918 D.A.R. track schematics. On all subdivisions but especially the Halifax and Kentville subs, the mileage on these 1918 charts may vary from mileages from earlier and later schedules. This is due to track changes after the C.P.R. leasing and upgrade of the line between 1911 and 1918 and especially to the Avon River River Causeway in 1970. We will continue to reference them based on the 1918 schematics though. A further note is that the 1918 schematics appear to have been updated until at least 1952 (South Uniacke) according to the notes on the drawings.
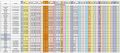
- Track chart clips are named by the the subdivision (HA, TR, KE, KI, WE, YA) and the mileage of the most prominent feature of the section. They were cross-referenced with the Memorandum of General Information on the Dominion Atlantic Railway, Feb. 17, 1969, Dominion Atlantic Railway, Library and Archives Canada HE2810 D7 D7 fol..
- Important note regarding stated mileages on Time Tables and Track Charts:
- Up to 1918 (and perhaps before), Middleton was the zero point for the Yarmouth Subdivision indicated by subtracting the adjustment of 27.58 miles from Annapolis Royal. This makes sense when the W&AR only ran to Annapolis Royal meaning the Halifax sub ran to Middleton and from Middleton to Annapolis Royal was another sub. The track charts we have show both the old and the new mileages. For conversion to the new mileages, subtract 27.58 from the old higher values. The titles of the wiki photo pages indicate the new mileage for the Yarmouth sub but most of the location titles on the drawings show the old. Many of the mileages in the Memorandum of General Information on the Dominion Atlantic Railway, Feb. 17, 1969, Dominion Atlantic Railway, Library and Archives Canada HE2810 D7 D7 fol. as well only show mileages to the 0.1 tenth but the track charts and quite a few time tables do show mileage to the 0.01 hundredth and these were used to title all the wiki Track Chart pages to the 0.01 accuracy.
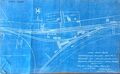
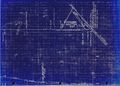
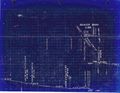
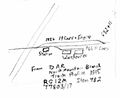
- Old and new mileages are shown on the track charts as circles and the lower values are the new mileages and the higher the old. Also interesting is that the charts from Bear River to Digby have the full height of the chart and show at the very bottom the surveyor chainage and rail details. In some of these charts in this section you will also notice revisions made in 1926.
Pages in category "Track Charts"
This category contains only the following page.
Media in category "Track Charts"
The following 84 files are in this category, out of 84 total.
 DAR Halifax Sub - Stations, Locations & Mileage.jpg 3,000 × 1,008; 332 KB
 HA-00.00 Windsor Junction CNR.jpg 2,000 × 865; 262 KB
 HA-00.00 Windsor Junction Stand Pipe Change.jpg 2,000 × 1,229; 319 KB
 HA-00.00 Windsor Junction.jpg 1,933 × 1,389; 751 KB
 HA-02.88 Beaver Bank.jpg 1,964 × 1,530; 365 KB
 HA-04.79 Fenertys.jpg 1,985 × 1,517; 303 KB
 HA-08.63 Grove's.jpg 1,975 × 1,485; 256 KB
 HA-10.19 South Uniacke Track Chart.JPG 1,948 × 1,500; 230 KB
 HA-10.93 Hibbit.jpg 2,004 × 1,530; 308 KB
 HA-12.77 Mount Uniacke Track Chart.JPG 1,951 × 1,500; 488 KB
 HA-16.47 Claremont's.jpg 1,678 × 1,200; 256 KB
 HA-18.00 Steam Shovel Siding.jpg 1,992 × 1,362; 423 KB
 HA-19.55 Stillwater.jpg 1,832 × 1,500; 358 KB
 HA-23.31 Ellershouse.jpg 1,997 × 1,530; 189 KB
 HA-24.58 Hartville.jpg 1,996 × 1,506; 184 KB
 HA-26.18 Newport.jpg 12,790 × 10,121; 3.17 MB
 HA-28.11 Three Mile Plains.jpg 1,968 × 1,500; 141 KB
 HA-29.90 Pembertons.jpg 1,932 × 1,500; 170 KB
 HA-31.60 Windsor.jpg 2,007 × 1,500; 249 KB
 DAR plan Windsor 1955-01 enhanced.jpg 4,500 × 1,802; 6.29 MB
 HA-32.47 Falmouth.JPG 1,910 × 1,427; 146 KB
 HA-34.54 Shaw's Bog.jpg 2,131 × 1,400; 281 KB
 HA-36.20 Mount Denson.jpg 2,010 × 1,566; 288 KB
 HA-38.60 Hantsport Track Chart.JPG 1,995 × 1,465; 330 KB
 HA-43.52 Avonport.jpg 1,834 × 1,494; 174 KB
 HA-45.93 Horton Landing.jpg 1,906 × 1,484; 182 KB
 HA-46.24 Grand Pre.jpg 2,030 × 1,400; 306 KB
 HA-49.14 Wolfville.jpg 2,016 × 1,500; 375 KB
 HA-50.93 Port Williams.jpg 12,962 × 8,588; 5.22 MB
 HA-52.42 New Minas Fruit Company.jpg 1,963 × 1,530; 157 KB
 KE-00.00 Kentville Roundhouse.JPG 1,181 × 800; 143 KB
 KE-00.00 Kentville.JPG 2,221 × 1,500; 785 KB
 KE-01.52 Frontenac Oil.jpg 1,931 × 1,289; 297 KB
 KE-04.40 Coldbrook.jpg 1,963 × 1,530; 835 KB
 KE-07.00 Cambridge.jpg 1,966 × 1,516; 780 KB
 KE-09.30 Waterville.jpg 1,933 × 1,416; 629 KB
 KE-17.50 Aylesford.jpg 1,951 × 1,524; 798 KB
 KE-17.89 United Fruit Co.jpg 1,924 × 1,424; 479 KB
 KE-19.10 Auburn.jpg 1,915 × 1,398; 665 KB
 KE-30.89 Middleton 1.jpg 1,453 × 968; 286 KB
 KE-30.89 Middleton 2.jpg 2,040 × 1,500; 881 KB
 KE-31.95 Chesley Brook.jpg 1,943 × 1,296; 767 KB
 KE-34.30 Brickton.jpg 1,980 × 1,530; 680 KB
 KE-44.70 Bridgetown.jpg 1,973 × 1,502; 841 KB
 LAC 1915 track plan.jpg 877 × 714; 140 KB
 DAR Yarmouth Sub - Stations, Locations & Mileage.jpeg 2,279 × 1,000; 563 KB
 YA-00.00 Annapolis Royal.jpg 1,990 × 1,530; 725 KB
 YA-04.78 Upper Clements.jpg 1,970 × 1,478; 735 KB
 YA-07.40 Clementsport.jpg 1,980 × 1,530; 629 KB
 YA-10.40 Deep Brook.jpg 1,948 × 1,530; 760 KB
 YA-12.86 Bear River Bridge.jpeg 979 × 859; 220 KB
 YA-13.62 Bear River.jpg 3,930 × 1,500; 1.66 MB
 YA-14.45 Imbertville.jpg 1,679 × 1,500; 726 KB
 YA-15.56 Smiths Cove.jpg 1,665 × 1,500; 728 KB
 YA-16.50 Big Joggins.jpg 2,374 × 1,500; 556 KB
 YA-17.80 Little Joggins.jpg 2,623 × 1,500; 1.07 MB
 YA-20.16 Digby East.jpg 2,250 × 1,500; 1,011 KB
 YA-20.16 Digby West.jpg 4,112 × 1,500; 1.62 MB
 YA-24.20 Acaciaville.jpg 1,977 × 1,530; 849 KB
 YA-28.04 Bloomfield.jpg 2,000 × 1,530; 964 KB
 YA-30.43 North Range.jpg 1,974 × 1,530; 881 KB
 YA-33.74 Plympton.jpg 1,994 × 1,530; 1.03 MB
 YA-35.42 Sissaboo Falls.jpg 1,986 × 1,530; 945 KB
 YA-35.93 Hill's.jpg 1,951 × 1,410; 1.03 MB
 YA-39.77 Becker's.jpg 1,935 × 1,288; 809 KB
 YA-41.35 Weymouth.jpg 1,983 × 1,530; 985 KB
 YA-43.38 St. Bernard's.jpg 1,364 × 1,530; 503 KB
 YA-45.99 Belliveau.jpg 2,000 × 1,530; 1,010 KB
 YA-50.15 Church Point.jpg 1,977 × 1,520; 969 KB
 YA-51.31 Little Brook.jpg 1,986 × 1,530; 1.03 MB
 YA-53.93 Saulnierville.jpg 1,971 × 1,530; 847 KB
 YA-61.01 Maxwelton.jpg 1,966 × 1,530; 723 KB
 YA-63.83 Sigogne.jpg 1,974 × 1,524; 751 KB
 YA-66.45 Hectanooga.jpg 1,991 × 1,530; 855 KB
 YA-68.15 Norwood.jpg 1,963 × 1,521; 630 KB
 YA-69.40 Lake Annis.jpg 2,009 × 1,519; 803 KB
 YA-73.58 Brazil Lake.jpg 1,989 × 1,530; 652 KB
 YA-76.34 Doane's.jpg 1,964 × 1,428; 583 KB
 YA-80.09 Ohio.jpg 1,983 × 1,530; 583 KB
 YA-82.34 Hebron.jpg 1,991 × 1,530; 658 KB
 YA-85.42 Yarmouth Wye.jpg 1,991 × 1,530; 683 KB
 YA-86.03 Yarmouth Station and Railyard.jpg 1,997 × 1,530; 721 KB
 YA-86.50 Yarmouth Rail Yard Blueprint.jpg 1,500 × 6,579; 609 KB
 YA-86.60 Evangeline Wharf.jpg 1,977 × 1,530; 717 KB


